Financial Dashboard
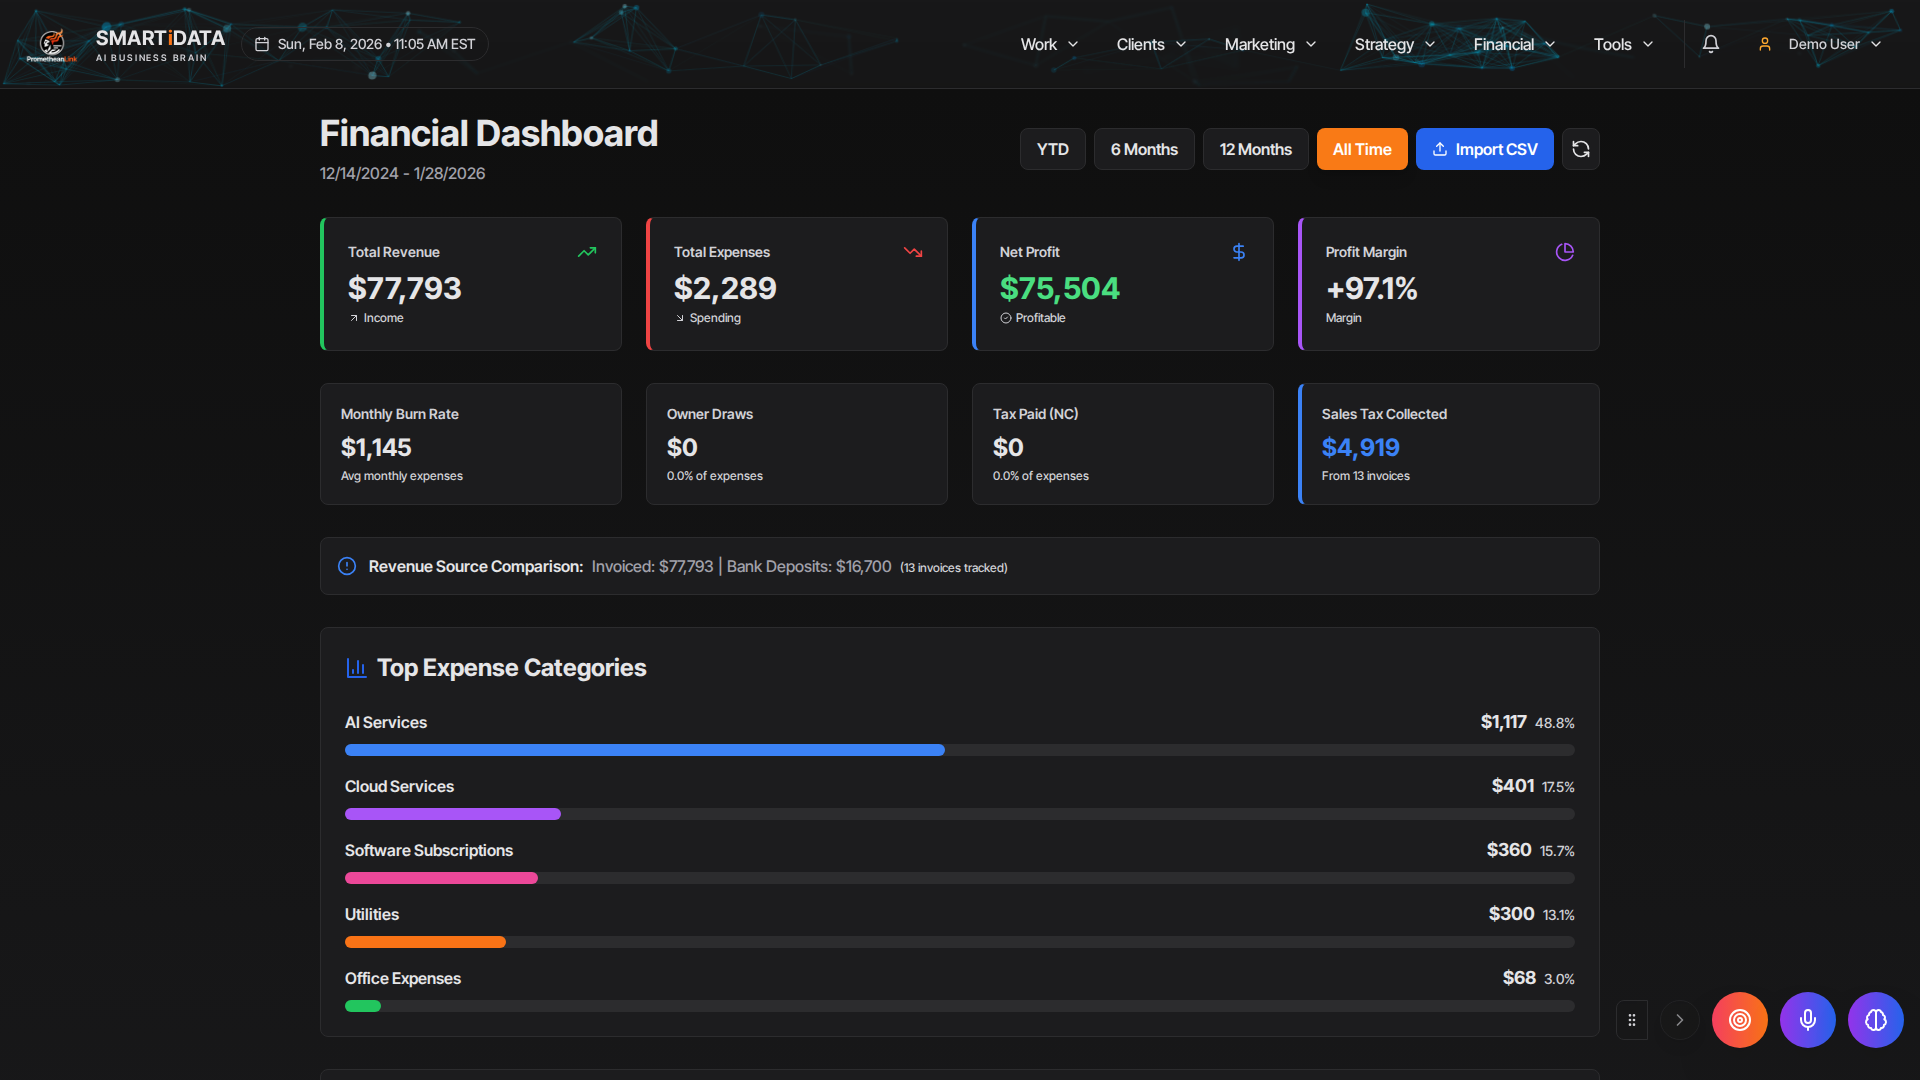
A financial overview dashboard that tracks revenue metrics, transaction history, and monthly trends by aggregating data from invoicing, point of sale, and ledger modules.
Key Benefits
How Financial Dashboard helps you work smarter
Revenue Tracking
See your total revenue, monthly trends, and income breakdown from invoices and point-of-sale transactions in real-time visualizations.
Transaction History
View all financial transactions across your business in chronological order with filtering by date range, type, and amount.
Monthly Trend Analysis
Track month-over-month changes in revenue, expenses, and profit margins to identify seasonal patterns and growth trends.
Consolidated View
Data from invoicing, point of sale, and the general ledger consolidates into one dashboard so you see your complete financial picture.
Full Capabilities
Everything included with Financial Dashboard
Financial Dashboard Questions
Common questions about Financial Dashboard
The dashboard aggregates data from your invoice payments, point-of-sale transactions, and general ledger entries. As you use those modules, the financial dashboard updates automatically.
Explore More Features
Financial Dashboard works seamlessly with these features
Ready to Get Started?
Try Financial Dashboard and all other features with a free trial.